
At Leadlord (opens in a new tab), the startup I run with my co-founder James, AI coding agents write most of our code and merge 50 to 100 changes a day, all on one 8-core server. In early October, a merge took a median of 16 minutes to land. A week later it took 86 seconds, 11 times faster. Most of that came from putting merges in a line, which honestly I should have done from the start. Then I worked out from first principles how fast our checks could possibly be, and let a Claude Opus 5.5 agent and 168 subagents hill-climb toward that floor overnight. On real past merges the agents never saw, the checks took 29% less time.
CI is becoming a bottleneck
By August, GitHub was seeing 2.9 billion commits a month (opens in a new tab). In October, it reported 7.38 billion for September alone (opens in a new tab), more than five times as many as a year earlier, though the two posts may not count commits the same way.
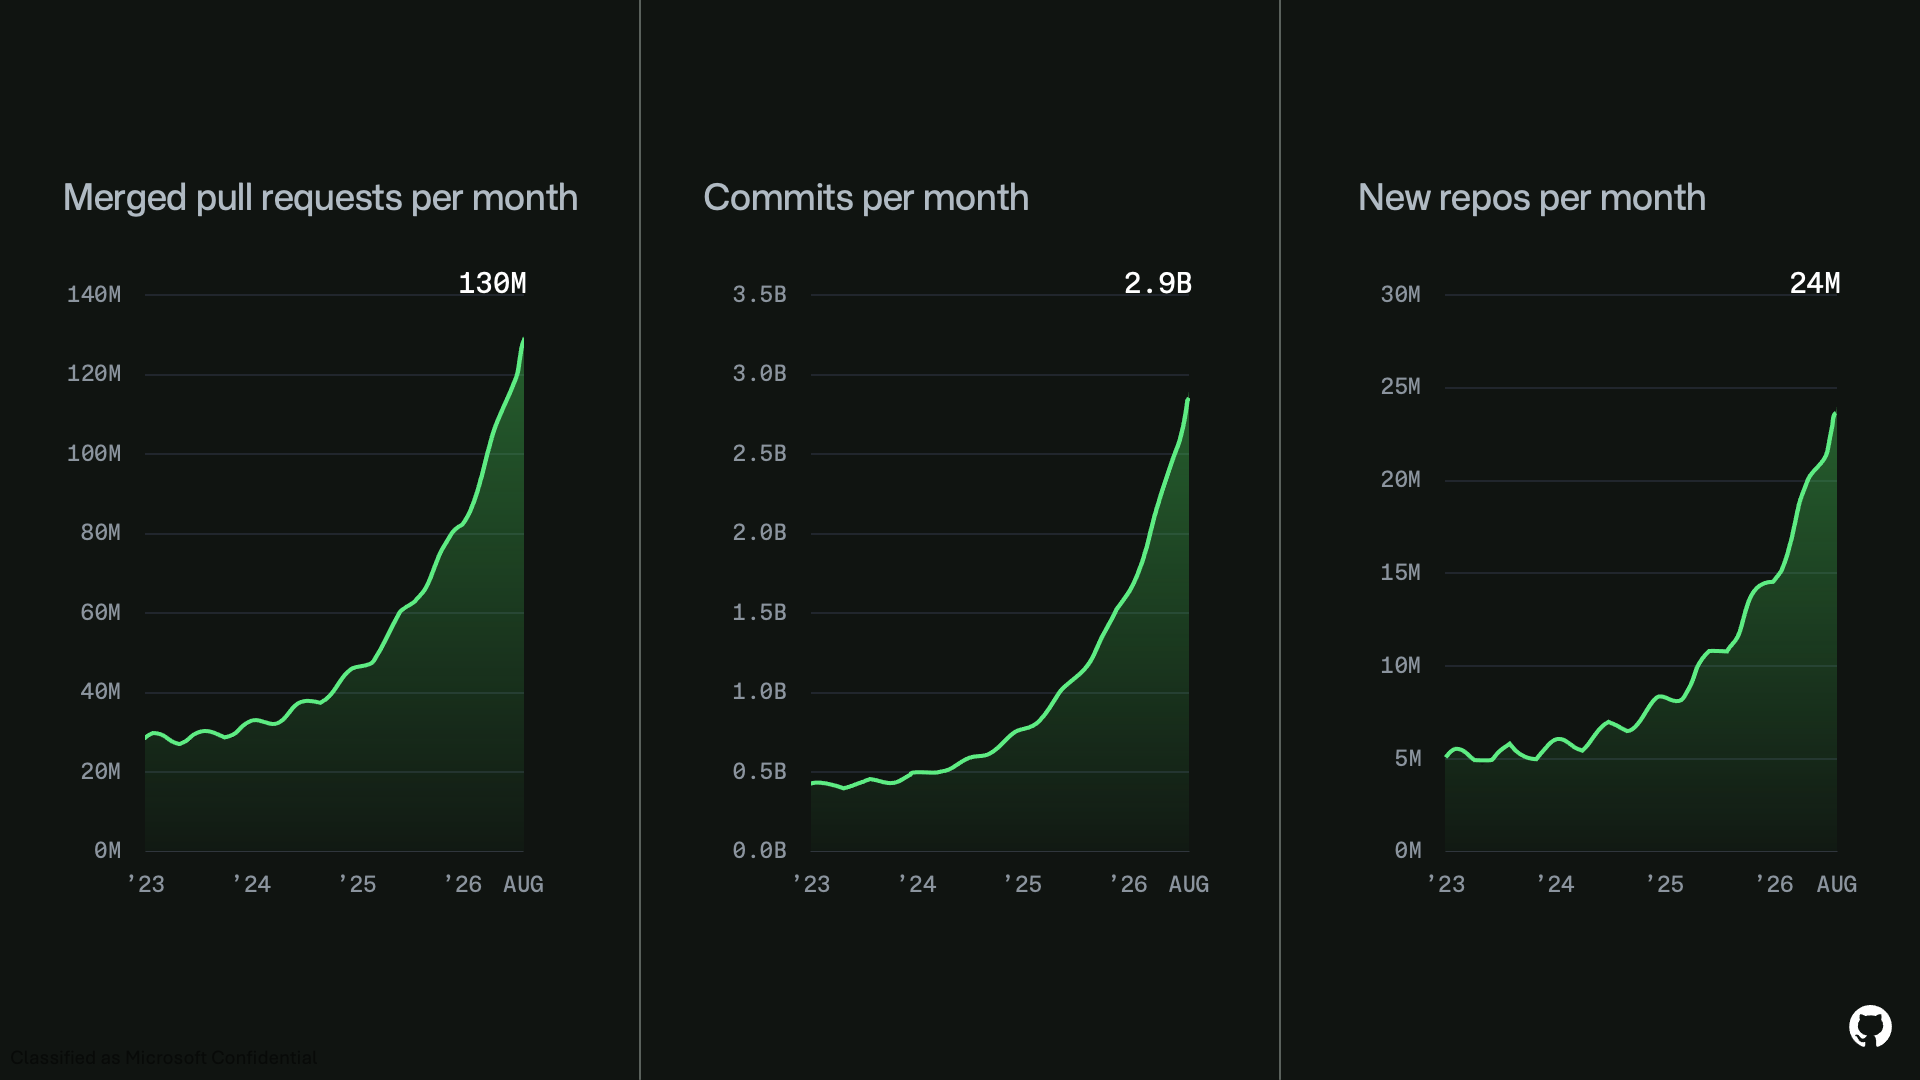
Commits a month on GitHub, January 2023 to August 2026.
Source: GitHub, The August 17 outage, and the work ahead (opens in a new tab), 20 Aug 2026.
Checking all that code didn’t get cheaper. In September, GitHub Actions ran 3.26 billion times (opens in a new tab), more than 4× as many as a year earlier. Anthropic saw a 25× increase in CI jobs (opens in a new tab) over six months, and at Linear, test suites have almost quadrupled (opens in a new tab) since January.
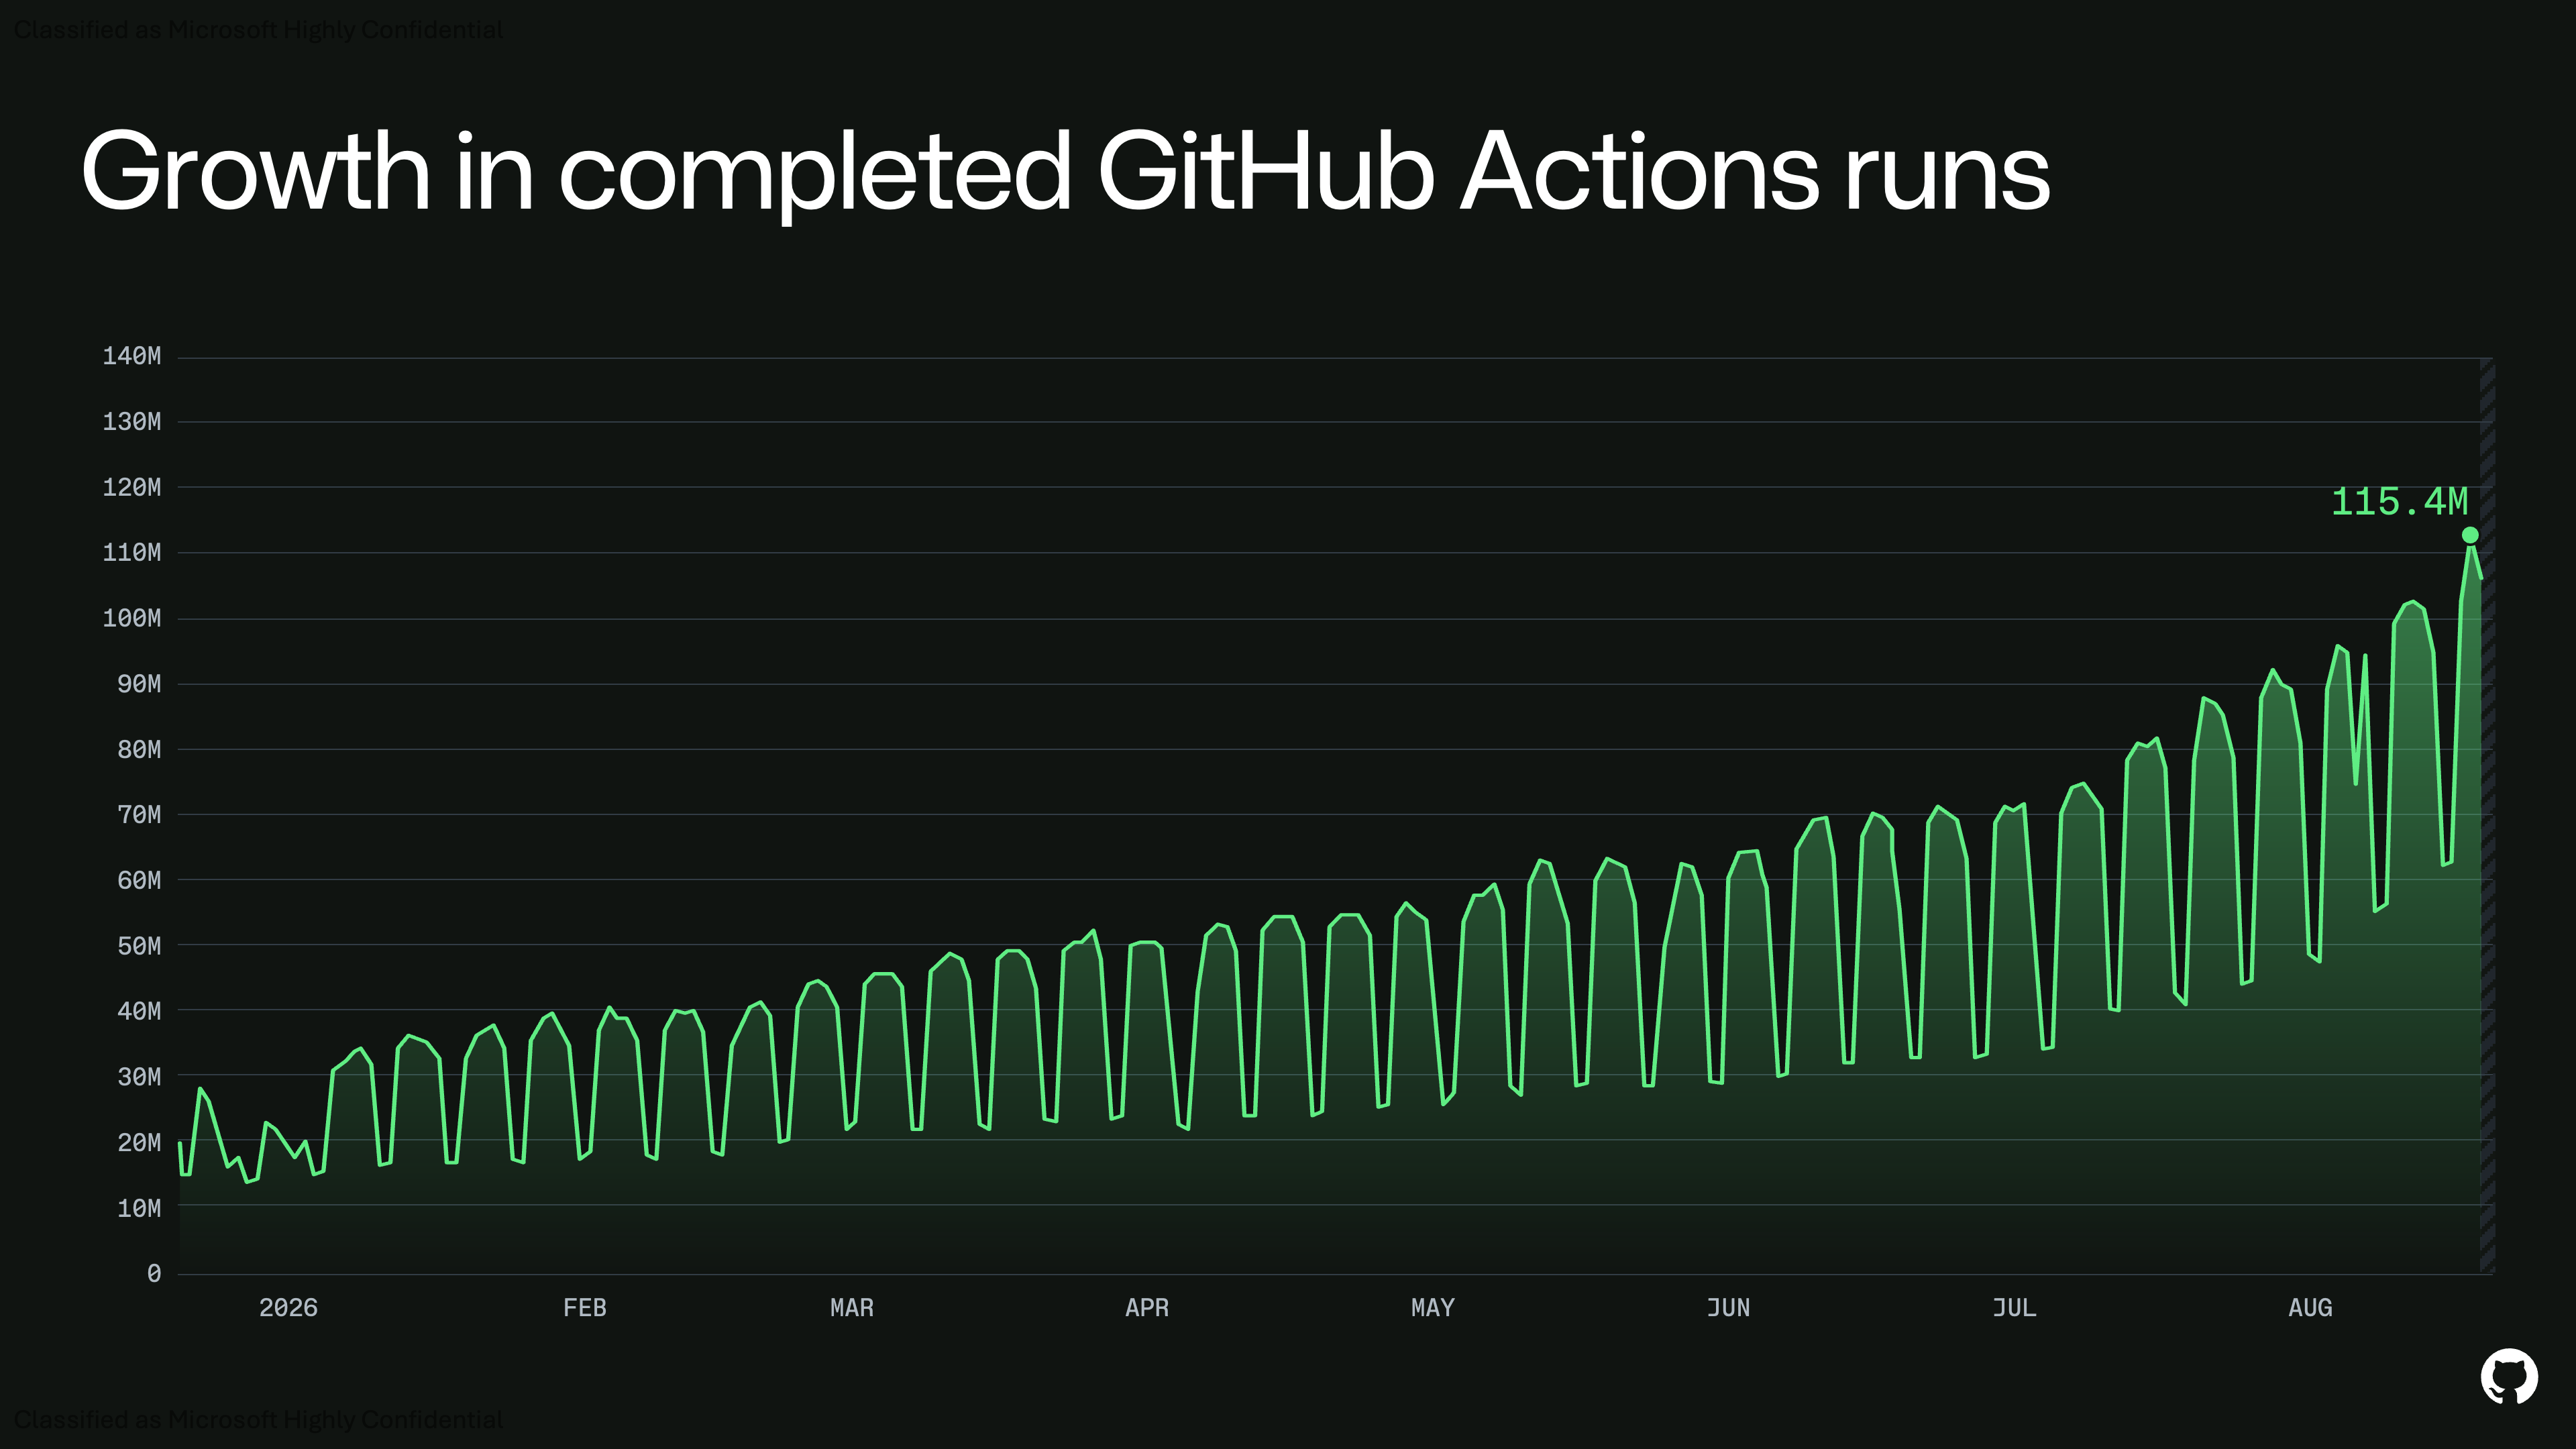
Completed GitHub Actions runs a day, January to August 2026.
Source: GitHub, The August 17 outage, and the work ahead (opens in a new tab), 20 Aug 2026.
Our repository shows the same. In the 18 days after Claude Opus 5.5 (opens in a new tab) came out on Sep 22, our agents finished about 71 tasks a day, against 47 in the three weeks before, with a median 704 changed lines each instead of 141 (non-blank lines added plus removed, without generated files or lockfiles). Our main branch went from 0.7 to nearly 2 million lines in those 18 days, and about half the new lines were tests. That’s more code for CI to check, on every change.
The code CI checks nearly tripled in 18 days
Non-blank lines on trunk, end of each day
| Day | Lines | Of which tests |
|---|---|---|
| Aug 31 | 471,009 | 137,500 |
| Sep 1 | 469,208 | 138,101 |
| Sep 2 | 482,376 | 141,220 |
| Sep 3 | 483,693 | 142,362 |
| Sep 4 | 494,340 | 149,499 |
| Sep 5 | 504,556 | 173,270 |
| Sep 6 | 501,237 | 167,509 |
| Sep 7 | 529,997 | 180,685 |
| Sep 8 | 544,332 | 197,184 |
| Sep 9 | 575,322 | 205,504 |
| Sep 10 | 597,530 | 217,343 |
| Sep 11 | 618,092 | 224,064 |
| Sep 12 | 622,067 | 225,188 |
| Sep 13 | 629,052 | 227,090 |
| Sep 14 | 623,441 | 225,776 |
| Sep 15 | 620,822 | 224,618 |
| Sep 16 | 619,702 | 224,461 |
| Sep 17 | 603,879 | 217,535 |
| Sep 18 | 645,452 | 229,934 |
| Sep 19 | 649,647 | 231,320 |
| Sep 20 | 660,541 | 236,142 |
| Sep 21 | 697,541 | 257,532 |
| Sep 22 | 719,853 | 268,948 |
| Sep 23 | 920,930 | 382,829 |
| Sep 24 | 1,030,037 | 443,208 |
| Sep 25 | 1,061,658 | 459,711 |
| Sep 26 | 1,082,909 | 470,586 |
| Sep 27 | 1,209,381 | 547,229 |
| Sep 28 | 1,283,917 | 591,213 |
| Sep 29 | 1,283,917 | 591,213 |
| Sep 30 | 1,346,405 | 629,625 |
| Oct 1 | 1,393,257 | 657,942 |
| Oct 2 | 1,496,329 | 720,046 |
| Oct 3 | 1,635,123 | 797,050 |
| Oct 4 | 1,677,531 | 817,215 |
| Oct 5 | 1,717,147 | 834,079 |
| Oct 6 | 1,782,064 | 851,744 |
| Oct 7 | 1,862,466 | 888,877 |
| Oct 8 | 1,909,173 | 913,505 |
| Oct 9 | 1,984,806 | 963,959 |
In late September, Lindy’s CEO Flo Crivello and OpenClaw’s creator Peter Steinberger put it more bluntly:


Same. @useblacksmith (opens in a new tab) has been an amazing sponsor but we need to distribute the load. My plan is to let codex decide which tests actually need to run and drastically nix CI and run tests hourly.
 Flo Crivello
 @Altimor
CI has become the top bottleneck of every engineering team I talk to (including Lindy). Our CI spend has become stratospheric.
Quoted post by Flo Crivello, on X (opens in a new tab)Running fewer tests is the obvious fix, but it’s harder than it sounds. When someone suggested a smaller, faster model to pick which tests run, Steinberger replied (opens in a new tab): “Tried; not smart enough.” If every change runs every check, checking grows faster than the work it protects.
Our setup: one server for everything
We run on one rented server in Montreal: an AMD Ryzen 7 9700X with 8 cores and 16 threads, 64 GiB of RAM and two mirrored NVMe drives, for about $98 a month. Production, staging, the development environment, T3 Code (opens in a new tab) (the app our agents run in), one git worktree per agent task and a CI virtual machine all share those 16 threads. We haven’t launched yet, so we accept that for now.
Everything competes for the same 16 threads
To land its work, an agent merges: a merge gate runs the checks CI would run on everything the change can affect, then squashes the branch into trunk, our main branch. The development environment serves trunk with hot reload, so I can try on my phone what the agents merged an hour ago. A bad merge would break it for everyone, so the gate also builds the apps and boots the dev servers.
Where you can try a change
CI then runs every check again on each push, as a second, clean check: the four real CI failures since Oct 5 had all passed the gate first.
Three times matter from here on: merge time, from an agent asking to merge to its answer, waiting in line included; gate time, just the checks; and CI time, the check job GitHub Actions runs after a push.
Putting merges in a line
At first, gates didn’t wait for each other: a new one started whenever the memory we forecast it would need fitted beside the others. But gates sharing a machine all finish late, and a gate on a busy server took 1.76 times as long as it did alone.
Why merges wait in line
Four merges, each a 4-minute gate alone
Side by side, a quarter of the server eachaverage 16 min
In a line, the whole server in turnaverage 10 min
An agent wants its answer fast, to fix a failure and try again. In a line, each gate runs about as fast as it would alone, so, with no cores idle, the average wait goes down. A separate agent session built the line: one heavy gate at a time, the next starting only while the server is healthy. GitHub’s merge queue (opens in a new tab) wasn’t an option, because our merges are local squashes into trunk, not pull requests.
The median merge went from 16 minutes in the three days before the line to 75 s on its first day. Where we logged it, the gate itself had a daily median of 157–235 s, so most of a merge was spent waiting to start. The same change also removed the memory forecasts, so we can’t split the gain between the two.
A line has its own cost: every failure and every slow gate is paid again by everyone behind it.
A test runner twice as fast, and two slow days
We also moved all 3,727 test files from Vitest to Bun’s test runner (opens in a new tab), one process per package, because isolating each file (opens in a new tab) would have cost about 3× on our Effect-heavy packages. CI’s test phase went from 597 s to 296 s, and its CPU time fell 2.7×.
Bun’s test runner: 4.9× faster than Vitest on Bun’s benchmark, 2.0× on our CI
Wall time in seconds; Bun’s benchmark on a log scale
| Run | Runner | Command or runs | Wall time |
|---|---|---|---|
| Bun's benchmark, one global per worker | Bun | bun test --parallel --no-isolate | 0.75 s |
| Bun's benchmark, one global per worker | Vitest | vitest run --no-isolate | 3.7 s |
| Bun's benchmark, fresh global per file | Bun | bun test --parallel | 6.8 s |
| Bun's benchmark, fresh global per file | Jest | jest | 19.1 s |
| Bun's benchmark, fresh global per file | Vitest | vitest run | 133 s |
| Our CI, full test phase | Vitest | median of 7 runs | 597 s |
| Our CI, full test phase | Bun | 2 runs | 296 s |
| Vitest ÷ Bun, Bun's benchmark, one global per worker | 4.9× | ||
| Vitest ÷ Bun, our CI | 2.0× |
Two choices made merges slower. First, we swapped our custom per-file test selector, whose store of recorded file reads once wrote 778 GB in 4.5 hours, for Turbo, our build tool, which reruns every package a change affects: a median 13.7% of test time per commit, against 3.4%. Second, Bun’s 5 s default test timeout, down from Vitest’s 30 s, failed about half of gate runs for an afternoon, until one 300 s limit, Bazel’s (opens in a new tab) default for a medium-sized test, replaced it and about 400 per-test limits. The coarser test selection, and packages running their files one at a time at first, more than doubled the median merge for two days, from 75 s to 198 s.
A faster type checker, tsc-rs (opens in a new tab) 0.1.0, checked our 86 projects in 50.4 s, against 112.0 s for TypeScript 7 (opens in a new tab) (both with Effect’s diagnostics). So every gate now type-checks too, at no added wall time.
The theoretical lower bound
Before the climb, I worked out how fast a gate could be. Two results from parallel computing, the work law and the span law (opens in a new tab), give that floor:
- Work ÷ threads. With 16 hardware threads, a gate does at most 16 CPU-seconds of work per second.
- The longest chain. A test step can’t finish before its slowest test file, however many threads there are.
A gate can’t be faster than the larger of the two. A broad gate (one for a change that touches most of the repository) ran about 1,000 CPU-seconds of tests, about 64 s on 16 threads. But its longest chain was a single backup test file that ran for 129 s.
One test file sets the floor
Server threads busy, average of 37 gates, by second
| Seconds since the tests started | Busy |
|---|---|
| 0–20 s | 96% |
| 20–40 s | 87% |
| 40–60 s | 79% |
| 60–80 s | 73% |
| 80–100 s | 59% |
| 100–120 s | 43% |
| 120–140 s | 33% |
| 140–200 s | 24%–29% |
| Floor: work ÷ 16 threads | 64 s |
| Floor: work ÷ real cores | 106 s |
| Floor: longest chain (one test file) | 129 s |
Work ÷ threads is also too optimistic. The 9700X’s 8 physical cores each run two threads, and sixteen busy threads did only about 1.2× the work of eight. Other work on the server slows a gate further.
That leaves two ways in: less work, which lowers both floors, and better packing (start the long steps first, remove late starts, fill idle threads). Packing came with a rule: added CPU, divided by 16, must be smaller than the wall time it saves, because once the gate is busy throughout, added CPU becomes wall time.
The overnight climb
Our agents followed Lance Martin’s Automating eval design and hillclimbing with Claude (opens in a new tab): build an eval (a fixed set of cases that scores every change) whose noise is smaller than the smallest win you’d act on. Hide some cases from the agent proposing changes. Make one change per round, and keep it only if both the tuning and held-out cases improve.
I set the goal and a few rules. The agents designed the eval, measured, made the changes, and merged and published them through the night without asking. Because production shares the server, they needed more guardrails than the method describes:
- Real past merges. 24 of them, three of each of 8 kinds of change, replayed on today’s code: 16 for tuning and 8 held out. Each round replayed 8 tuning merges, one of each kind, and the score is the expected gate time per merge, each kind weighted by how often it merged in our last 1,000 commits.
- Noise first. Timing noise was 41% with busy runs included, so every trial waits for a quiet server. The same code against itself then gave 1.7%.
- Known-bad patches. 17 changes, a flaky test among them, must keep failing the gate: our anti-cheat. If one passes, the change scores zero.
- “Never weaken a check to make it faster.” No skipping or quarantining tests, no narrowing a step’s inputs, and no change to the eval itself.
- A fresh reviewer for every change, and one orchestrator session for every merge and publish, with at most 20 subagents at a time.
How the climb ran
Round 1 ran the browser tests in parallel workers. The tuning merges got 7% faster and the held-out ones didn’t, so it was reverted as overfitting: the method doing its job. To move faster, changes from round 3 on merged without a held-out check of their own: round 3’s on a tuning-set win alone, later ones on their authors’ timings and a fresh review. Only the final eval measured them, together. In about 29 hours, one orchestrator and 168 subagents merged 77 changes.
What the agents found
The week’s biggest single wins, each timed on its own:
Four changes, 5× to 11× faster each
Seconds, before → after; each card on its own scale
| Change | When | Measured on | Before | After | Speed-up |
|---|---|---|---|---|---|
| A leaked 30 s sleep | Overnight climb, Oct 8 | One test suite, inside the gate | 33 s | 3 s | 11× |
| React’s 300 ms waits | Overnight climb, Oct 8 | Product UI tests, quiet machine | ~50 s | ~5 s | 10× |
| Pruned image build | Overnight climb, Oct 8 | Rebuild a service image for a deploy, one-file change | 142 s | 18 s | 7.9× |
| Backup tests built once | Before the climb, Oct 5–7 | The suite holding the 129 s test file | 147 s | 27 s | 5.4× |
Two of them were sleeping tests. React 19 waits 300 ms before showing content whose data arrives outside its act() test wrapper, and one suite did that 146 times. Elsewhere, a race left a 30-second sleep holding a suite’s output open. Separately, each test step’s cache key now covers exactly the files its tests read, which fixed 15 steps that could have reused a stale cached pass.
Gate tests run at low CPU priority to keep production responsive, so under load, tests with hand-picked time limits ran past them. Now a test that passes only on rerun still fails the gate, and flakes get fixed at the cause instead of retried. Of 81 failed tries on Oct 9–10, 5 were flakes, and most of the rest were a check catching a real problem. No CI check on trunk failed (0 of 33).
Results: from 16 minutes to 86 seconds
We compare three full windows (UTC): Oct 2–4, before the line; Oct 5–7, with the line but before the climb; and Oct 9–10, the two full days after it. Oct 8, the night of the climb, is in none of them.
| Every landed merge | Oct 2–4 | Oct 5–7 | Oct 9–10 |
|---|---|---|---|
| Merges | 240 | 175 | 117 |
| Merge time, median | 965 s | 172 s | 86 s |
| Merge time, p90 | 2,422 s | 388 s | 299 s |
| Under 2 minutes | 9% | 27% | 59% |
| Gate time, median, where logged | 218 s (48 merges) | 155 s (98) | 68 s (111) |
| CI check time per landed merge | 234 s | 82 s | 53 s |
Counting every merge, the median got 11 times faster end to end, and the 90th percentile went from 40 minutes to under 5. CI’s check job went from a median of 407 s to 193 s. With more merges in each push, CI now spends 53 s of check time per landed merge instead of 234 s.
A merge also slows down when unrelated work shares the server, which says nothing about the gate. So for the climb’s before and after, we also compare merges on a quiet server: those during which work other than merges and CI used at most 3.2 of the 16 threads on average, the 20% our own tooling counts as contention. That keeps 70 of 175 merges from Oct 5–7 and 40 of 117 from Oct 9–10 (Oct 2–4’s server was rarely quiet enough). Their median went from 159 s to 63 s, and 73% now land in under 2 minutes, against 24%. To be fair, much of that gain is winning back the migration’s two slow days.
On a quiet server, merges went from 2.7 minutes to about a minute
One dot per merge on a quiet server
| Window | Quiet merges kept | All landed | Excluded | Median | p90 | Slowest | Under 2 minutes | Over 5 minutes | Source |
|---|---|---|---|---|---|---|---|---|---|
| One gate at a time, Oct 5–7 | 70 | 175 | 105 | 159 | 255 | 922 | 17 of 70 (24.3%) | 4 of 70 (5.7%) | rebuilt from one founder's logs |
| After the climb, Oct 9–10 | 40 | 117 | 77 | 63 | 180 | 640 | 29 of 40 (72.5%) | 3 of 40 (7.5%) | live merge ledger, both founders |
The controlled eval leaves out the server’s load and the migration. It replays each merge on trunk as it stood just before and after the climb, on a quiet server, so it measures everything merged that night together, other tasks included. On the 8 held-out merges, the expected gate time per merge went from 84.9 s to 60.6 s: 29% less.
On 8 real merges the agents never saw, gate time fell 29%
Gate time per replayed merge, seconds
| Kind of change | Set | Before | After | Change | CPU-s before | CPU-s after |
|---|---|---|---|---|---|---|
| Docs only | Held out | 19 | 13 | −30% | 92 | 71 |
| One package | Held out | 25 | 14 | −45% | 208 | 82 |
| Several packages | Held out | 29 | 19 | −34% | 265 | 137 |
| Shared library | Held out | 147 | 111 | −25% | 1,583 | 1,229 |
| An app | Held out | 60 | 34 | −43% | 363 | 200 |
| Backend (Convex) | Held out | 150 | 112 | −25% | 1,600 | 1,244 |
| Toolchain | Held out | 155 | 121 | −22% | 1,743 | 1,408 |
| Lockfile | Held out | 156 | 120 | −23% | 1,742 | 1,410 |
| Docs only | Tuning set | 19 | 13 | −30% | 92 | 72 |
| One package | Tuning set | 28 | 16 | −41% | 248 | 121 |
| Several packages | Tuning set | 94 | 67 | −29% | 911 | 618 |
| Shared library | Tuning set | 76 | 58 | −24% | 754 | 443 |
| An app | Tuning set | 63 | 34 | −46% | 361 | 201 |
| Backend (Convex) | Tuning set | 105 | 71 | −32% | 1,173 | 744 |
| Toolchain | Tuning set | 102 | 74 | −28% | 1,120 | 811 |
| Lockfile | Tuning set | 154 | 120 | −22% | 1,733 | 1,407 |
| Held out, weighted by how often each kind merges | Held out | 84.9 s | 60.6 s | −29% | ||
| Tuning set, weighted the same way | Tuning set | 71.4 s | 48.8 s | −32% | ||
| Held out, typical merge, unweighted (geometric mean) | Held out | −31% | ||||
| Gate CPU time, all 16, weighted the same way (unweighted) | Both | −41% (−35%) |
Test coverage held up: the share of product files run by at least one test rose from 94.0% to 96.4%, and across all files it went from 91.5% to 91.0%.
About the data: we rebuilt Oct 2–7 from one founder’s logs, and Oct 2–4 include a few hung merges. Oct 9–10 come from the live merge log, with both founders’ merges, and from partway through Oct 9 merges were also gated together. CI isn’t in the eval, because its replay runner never finished a full run, so the CI numbers are production data.
Next: fast merges in busy hours
The gate is short now, but merges still slow down when production, agents and CI all run at once. Since Oct 9, we gate waiting merges together, like bors (opens in a new tab) and Mergify’s batches (opens in a new tab) do, and if a batch fails we refuse only the change at fault. Through Oct 10, 120 of 128 batch gates held a single merge, so the line is mostly empty now. What’s left is shared load and memory, and that’s where we’re looking next.
What one server costs
Before the server, we got by on managed services’ starter plans. Vercel hosted the apps, Convex ran the backend, Trigger.dev the background jobs and Fly.io a Discord bot. CI ran on GitHub’s included minutes until we used them up, then on Blacksmith’s free tier, and the agents ran on my laptop until it throttled so much I couldn’t use it.
On Aug 19, Convex disabled all our projects, production included: we had “reached your configured monthly spending limit threshold of $NaN”, though our invoices up to Aug 8 showed us using under a fifth of the plan’s included usage. Yes, $NaN. With usage pricing, you choose between a spending limit that can take you offline and a bill with no ceiling. I’d already been pricing servers, and the next day I rented one.
It now runs all of it. Each environment has its own copy of Convex’s open-source backend (opens in a new tab), Convex’s own scheduler replaced Trigger.dev, and our CI and merge gates run at no extra charge. So the fair comparison is today’s workload, with and without the server:
| Today’s workload | Without the server | With the server |
|---|---|---|
| App hosting | Vercel Pro, ~$71 a month | on the server |
| Backend | Convex Pro, $50 a month plus usage | open-source Convex |
| Background jobs | Trigger.dev, $10 a month plus compute | Convex’s scheduler |
| Discord bot | Fly.io, ~$6 a month | on the server |
| CI and merge gates | Blacksmith, ~$170–300 a month | on the server |
| Dev environment and agents | cloud agent VMs, nothing shared | on the server |
| Total | about $310–440 a month, plus usage | about $98 a month, flat |
The first four rows are our last bills or today’s plan prices. Blacksmith (opens in a new tab), a hosted runner service, is a strong option: about a quarter cheaper per minute than GitHub, with a clean machine for every job, so busy hours wouldn’t slow merges down. Scaled from our measured job times, our CI plus about 85 merge gates a day would cost roughly $170–300 a month there.
Every managed plan also has limits:
- Convex Pro: 50 GB a month each of data egress and database I/O before overage, and 300 deployments per team.
- Vercel Pro: functions stop after 300 s by default, builds after 45 minutes, and runtime logs last a day.
- Trigger.dev Hobby: 50 concurrent runs, 100 schedules and logs for 7 days.
- GitHub-hosted runners: 6 hours per job and a 10 GB cache per repository.
- Cloud agent VMs, like Claude Code on the web (opens in a new tab): 4 vCPUs, 16 GB and no background processes once the VM pauses.
The server’s limits are the hardware’s.
Having the agents on the same box matters as much as the price. They share one filesystem, one dev environment, one merge line and one Turbo (opens in a new tab) build cache. So the merge gate restores any step an agent already ran, and an agent can run the real app, read the server’s logs or wait on another agent’s run.
It isn’t free. About 17% of our commits since we moved, on Aug 20, were server work, and we’ve had real incidents, from errors across production after our reverse proxy was recreated to an agent’s render jobs running the server out of memory. Agents wrote most of those commits, which makes running our own servers affordable for two people. One $200 Claude Max plan covers about 24 billion tokens a month by our count, so the climb’s 5.24 billion tokens, $2,100–2,500 at API prices, cost us about $43.
What I’d tell another team
- Keep patches the gate must refuse. When agents optimise your CI, score any change that lets one through as zero, instead of trusting agents to be careful.
- Put merges in a line. Think of merges as jobs: unless gates leave cores idle for most of their run, one at a time gives a shorter average wait.
- Work out the floor first, in physical cores. The larger of work ÷ cores and the longest chain tells you what to attack.
- Look for sleeping tests. Some of our biggest wins were tests waiting on timers.
- Measure big migrations in production too. Our test-runner switch was right in principle and still more than doubled the median merge for two days.
- Price the whole setup, not one service. Merges, the backend, the dev environment and the agents all need machines.
Code will keep getting cheaper to write. Checking it only gets cheaper if you measure where the time goes, and let agents climb only where the eval can catch them cheating.
Sources
Agents and CI
- GitHub, Vlad Fedorov, The August 17 outage, and the work ahead (opens in a new tab), 20 Aug 2026.
- GitHub, Brian Celenza, Building Git infrastructure for agent-scale development (opens in a new tab), 6 Oct 2026.
- Anthropic, Sachin Malhotra, Agentic coding is straining CI. Here’s how we scaled test impact analysis at Anthropic (opens in a new tab), 14 Sep 2026.
- Linear, Mufeez Amjad, AI coding has made CI a bottleneck, so we reworked ours to keep up (opens in a new tab), 21 Sep 2026.
- Anthropic, Introducing Claude Opus 5.5 (opens in a new tab), 22 Sep 2026.
- Flo Crivello, post on X (opens in a new tab), and Peter Steinberger, post (opens in a new tab) and reply (opens in a new tab) on X, 27 Sep 2026.
Our setup
- T3 Code (opens in a new tab) and its source (opens in a new tab).
- Claude Code, cloud environments (opens in a new tab).
- Turborepo, Caching (opens in a new tab), including its Git worktree cache sharing (opens in a new tab).
- Convex, self-hosting the open-source backend (opens in a new tab).
Costs and limits (prices and limits checked 11 Oct 2026, all in US dollars; our bills in Canadian dollars converted at the ECB rate of the day they were charged)
- Blacksmith, pricing (opens in a new tab).
- GitHub, Actions runner pricing (opens in a new tab).
- Convex, pricing (opens in a new tab) and limits (opens in a new tab); Vercel, Pro plan (opens in a new tab) and pricing (opens in a new tab); Trigger.dev, pricing (opens in a new tab); GitHub, Actions limits (opens in a new tab).
Tools
- Bun, test runner (opens in a new tab) and parallel and isolated runs (opens in a new tab).
- Bazel, Test encyclopedia (opens in a new tab) (default timeouts per test size).
- Daniel Rosenwasser, Announcing TypeScript 7.0 (opens in a new tab), 8 Jul 2026.
- Ping, ts-rust (tsc-rs) (opens in a new tab).
Method
- Analysis of parallel algorithms (opens in a new tab) (the work and span laws), and MIT 6.172, Analysis of Multithreaded Algorithms (opens in a new tab).
- Anthropic, Lance Martin, Automating eval design and hillclimbing with Claude (opens in a new tab), 28 Sep 2026.
Merge queues